Dubai real estate credit risk is becoming more visible in credit markets than in property listings. While asking prices continue to dominate headlines, developer bond spreads increasingly reveal where investors see funding pressure and structural market risk. This article explains why credit conditions—not headline prices—offer the earlier signal.
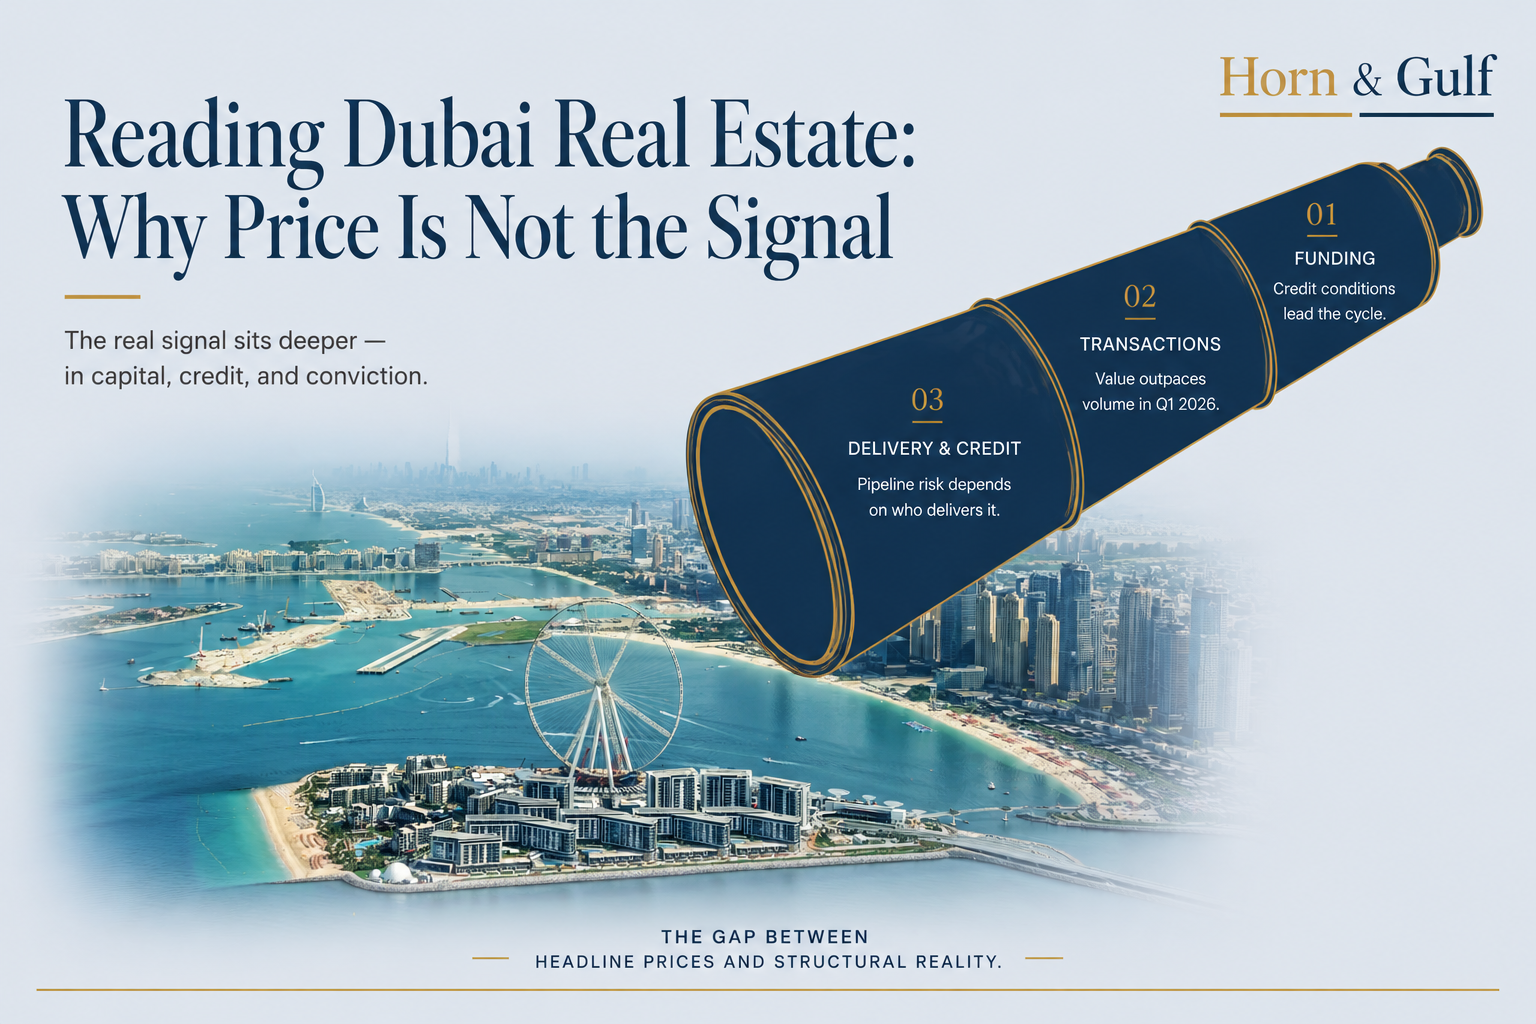
Every correction in Dubai property produces the same headline reflex. Prices are falling, so the market must be weakening. That reflex is almost always wrong.
Not because Dubai is immune to stress. Because price is a lagging, noisy variable. The real signal sits one layer deeper: who can still access capital, on what terms, and for how long.
This piece is not an argument that Dubai real estate is safe. It is a guide to where to look before you decide whether it’s safe for your investment.
Asking Prices Are Not the Market
A seller cutting a listing from AED 8M to AED 5M doesn’t define market value. It defines that seller’s urgency.
What actually clears — the registered transaction — is the only reliable datapoint. Even that is backward-looking. By the time a deal registers with the Dubai Land Department, the decision behind it happened weeks earlier.
What Q1 2026 Actually Showed
The headline numbers explain why this distinction matters. DLD-derived figures show 47,996 total sales transactions in Q1 2026. That’s down 16.2% from Q4 2025, but still up 5.5% year-on-year.
Total sales value reached AED 176.7 billion, a 23.4% jump year-on-year. January 2026 alone recorded AED 72.4 billion — the highest single month on record. Average price per square foot rose 12.5% year-on-year to AED 1,759.
[Figures compiled from DLD-registered transaction data via market brokerage reporting. Confirm exact quarter-end totals against the Dubai Pulse open data portal before publication.]
Value Is Outpacing Volume — And That’s the Real Story
Read as a headline, this looks like unambiguous strength. Read as a structure, it says something more specific: fewer, larger, higher-conviction transactions are clearing. Marginal buyers are stepping back.
That’s not “boom” and it’s not “bust.” It’s exactly what credit markets are pricing right now — which brings us to the funding layer.
Where the System Is Actually Tightening
The pressure point isn’t the listing page. It’s the funding layer.
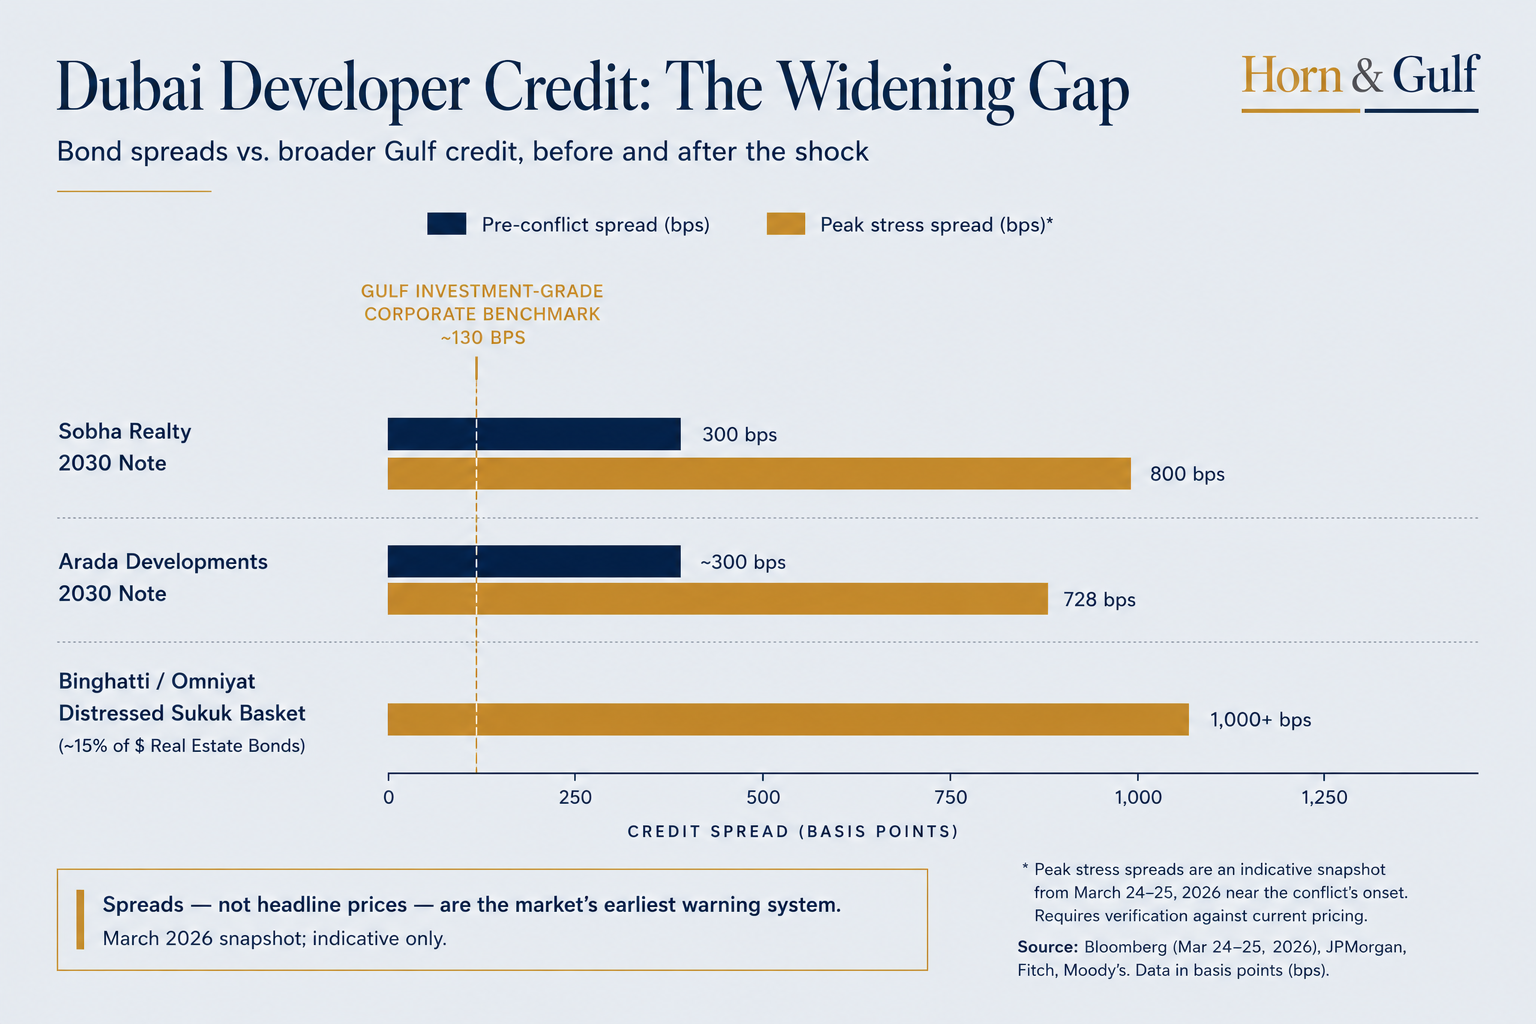
JPMorgan’s credit research shows Dubai developer bonds sitting materially wider than pre-conflict levels. Meanwhile, the broader CEMBI emerging-market high-yield benchmark has largely recovered. That gap — not the headline price index — is the more honest measure of market risk. People with capital at stake for years, not months, are pricing it this way.
The Basis Points Behind the Story
Numbers tell this story better than adjectives do.
At the height of the initial shock in late March 2026, Bloomberg-compiled data showed six dollar-denominated sukuk from Binghatti Holding and Omniyat Holdings trading at distressed levels. Spreads sat above 1,000 basis points over the risk-free rate. Together, these six bonds represented roughly 15% of dollar-denominated real estate bonds across the Middle East.
Bonds that hadn’t crossed the distress threshold still moved sharply. A Sobha Realty 2030 note saw its risk premium surge from under 300bps to roughly 800bps. An Arada Developments 2030 security more than doubled, to 728bps.
For context: investment-grade Gulf corporate issuance averaged spreads closer to 130bps over benchmarks in the same period. That gap shows how sharply the market singled out real estate relative to other regional credit.
[Source: Bloomberg, reported March 24–25, 2026 — a peak-stress snapshot near the conflict’s onset. Recheck against current JPMorgan CEMBI or Bloomberg pricing before publication; this data moves weekly.]
JLL Confirms the Same Signal, From a Different Angle
JLL’s Q1 2026 UAE Living Market Dynamics report backs up the bond-market story. Weekly transaction values fell by nearly 50% compared to pre-conflict averages at the height of the shock, before moderating.
JLL states the risk directly: the large pipeline of future stock raises the danger that falling demand disrupts the supply-demand balance.
Off-plan sales rose 9.5% year-on-year even as secondary-market sales fell 8.2%. Residential price appreciation slowed to an 8–12% annual pace — down from 16–19% in the prior cycle. (Source: JLL UAE Living Market Dynamics, Q1 2026)
Two instruments, one signal: funding conditions tightened before prices did.
One Market, Three Balance-Sheet Realities
Dubai isn’t a single credit story. It’s a stack of balance sheets operating under different constraints — and bond spreads now show the differences, not just commentary.
Three Developer Tiers
- Tier One — balance-sheet driven. Sovereign linkage, diversified income, large cash buffers. These developers move first, but from optionality, not distress. They can delay launches and hold pricing while waiting for conditions to normalize.
- Tier Two — flow dependent. Real sales momentum, but reliant on continuous off-plan cycles. Their exposure is conditional. If funding stays tight, pressure moves from pricing to collections, then from collections to launch pace.
- Tier Three — capital constrained. Smaller developers already being repriced. Watch for widening spreads and growing reliance on buyer-funded payment structures instead of bank financing.
The Ratings Picture Right Now
Fitch placed both Binghatti and Omniyat on watch for possible downgrade in March 2026. Its stated reasons: demand risk and rising construction costs. Fitch also noted both firms entered the volatility with solid balance sheets.
Moody’s took the opposite stance the same week. It affirmed Binghatti’s rating, citing good 12-month liquidity coverage against the company’s February 2027 maturity.
Binghatti’s own Q1 2026 results, released weeks later, showed net profit up 73% year-on-year to AED 1 billion, with a cash position of AED 9 billion. A distressed bond spread and a strong operating quarter can coexist — this is the accounting-lag dynamic from the top of this piece, playing out in real time.
DAMAC has seen comparatively tighter spreads on new issuance. The market is differentiating established, diversified names from newer, narrower ones.
[Recheck all figures above against each company’s latest investor disclosures and current rating-agency actions. Ratings and spreads are the fastest-moving numbers in this entire piece.]
Reading Payment Plans Correctly
A long post-handover payment plan can mean two opposite things. It can signal a well-capitalized developer competing aggressively on terms. Or it can signal a constrained developer replacing bank financing with buyer cash.
The structure looks identical on a brochure. The balance sheet behind it isn’t. This is exactly where most retail investors misprice risk — by reading terms instead of funding conditions.
Three Markets, Not One
Layer a geographic question on top of the credit question. Dubai property behaves as three distinct segments. Conflating them is the second most common analytical mistake, right after conflating price with market health.
The Three Segments
Global trophy assets — Palm Jumeirah, Palm Jebel Ali, Jumeirah Bay, Emirates Hills — trade on global wealth allocation, not local cycles. Demand here is structural: jurisdictional safety and legal continuity, not yield-chasing. That’s why this segment stays least sensitive to local supply news.
Prime urban core — Downtown, Dubai Marina, Business Bay, DIFC-adjacent districts — is the execution layer. Demand comes from relocating entrepreneurs and long-term residents. Liquidity narrows under stress but doesn’t disappear. Developer credibility increasingly functions as the actual currency of the transaction.
Speculative expansion zones — JVC, Dubai South, Arjan, Dubailand — move first in both directions. They benefit disproportionately when liquidity is rich. They absorb the most pressure when capital turns selective. This is exactly the segment most exposed to the delivery pipeline below.
Why the Delivery Pipeline Matters
That pipeline isn’t abstract. JLL forecasts roughly 59,000 residential units delivered across Abu Dhabi and Dubai for the rest of 2026, plus another ~92,000 units in 2027. JLL flags this figure itself as sensitive to supply-chain delivery slippage. (Source: JLL, via Gulf Business reporting, June 2026)
Separately, brokerage data shows Dubai passing the 10,000-apartment handover mark for two straight months in Q1 2026. An estimated 65,000 more apartments and 12,500 villas are scheduled before year-end. [Source: Property Finder market report, via secondary reporting — cross-check against the DLD completions register.]
Here’s why the tiering above matters: concentrate that pipeline inside Tier Three developer projects in the speculative-expansion segment, and it’s a real risk. Concentrate the same number inside Tier One projects in the prime urban core, and it’s close to irrelevant.
The Governance Layer: What the Emaar Restructuring Signals
In May 2026, Dubai Holding became Emaar’s dominant shareholder. It acquired a major stake previously held by ICD, Dubai’s sovereign investment vehicle.
Read narrowly, this is an internal cap-table adjustment. Read structurally, it signals something bigger. Emaar’s balance sheet touches Downtown, Dubai Mall, hospitality income, and waterfront expansion all at once. Dubai appears to be managing the coherence of that flagship ecosystem during a period of regional fragmentation.
The honest reading names the risk this creates, not just the resilience it implies. As alignment between flagship developers and state-linked holding structures deepens, competitive diversity in parts of the market can narrow. Tighter coordination improves execution capacity during stress. It doesn’t automatically improve pricing outcomes for buyers who rely on developer competition to keep prices disciplined.
What Would Actually Break This Thesis
No investment framework is complete without the scenario where it fails. Two conditions matter most.
- Delivery-to-demand mismatch inside Tier Two/Three projects. Suppose a large share of the 2026–2027 pipeline — JLL’s combined estimate runs near 150,000 units — completes on schedule inside the speculative-expansion segment. Suppose international buyer participation stays below pre-conflict levels at the same time. Discounting will show up first in Tier Three developer collections, before it shows up in headline price indices.
- Credit spreads widening instead of compressing over the next two to three quarters. If Dubai developer bond spreads keep diverging from the recovering CEMBI benchmark, rather than converging toward it, that tells you something important. The market would be pricing a longer repair cycle than the “temporary repricing” narrative assumes — no matter how strong quarterly transaction-value headlines look.
Neither condition holds true today. Both are checkable, quarter by quarter, using the public sources cited throughout this piece.
Indicators to Track — And Where to Get Them
| What to watch | Why it matters | Primary source |
|---|---|---|
| Developer bond spreads vs. CEMBI HY benchmark | Credit investors price stress before property data shows it | JPMorgan / S&P / Moody’s / Fitch developer notes |
| Installment collection rates by developer tier | Separates real balance-sheet strength from lagging reported profit | Developer investor-relations disclosures; DFM filings |
| Registered transaction value vs. volume (DLD) | Value outpacing volume signals concentration, not broad strength | Dubai Land Department / Dubai Pulse open data |
| Off-plan vs. secondary market split | Off-plan resilience can mask secondary-market repricing | JLL / CBRE quarterly market reports |
| Actual completions vs. announced delivery schedule | Pipeline risk depends on delivery timing, not headline unit counts | DLD completions register; JLL supply tracking |
| Rental contract value and price per sqm | Contract volume can hold flat while per-unit rents soften | Ejari data via DLD / Dubai Pulse |
| International buyer share of new transactions | Most exposed variable if regional tension resumes | DLD nationality-of-buyer data; JLL / Knight Frank surveys |
The Honest Conclusion
The evidence as of mid-2026 supports a repricing story, not a distress story. Construction continues. Collections continue. Dubai’s structural advantages — the dirham peg, DIFC’s common-law framework, aviation and logistics connectivity — remain real.
But “repricing, not distress” is a conditional statement, not a permanent one. It holds only as long as installment collections stay steady, international capital keeps returning, and the delivery pipeline lands more heavily on Tier One balance sheets than Tier Three ones.
The investors who read this cycle correctly won’t be checking listing prices. They’ll be checking, every quarter, whether that condition still holds — using bond spreads, DLD transaction-value data, and actual completion rates instead of headlines.
Editorial verification note: Bond-spread figures for Binghatti, Omniyat, Sobha and Arada come from Bloomberg’s March 24–25, 2026 reporting — a peak-stress snapshot near the conflict’s onset, not a current reading. Refresh these against live pricing before publication. Fitch and Moody’s actions cited date from the same window and may have since changed. Verify all DLD figures against the Dubai Pulse open data portal, and JLL figures against the current quarter’s UAE Real Estate Market Dynamics report. Both sources update quarterly, so treat every number in this draft as perishable